Selected geospatial work across remote sensing, machine learning, public health, humanitarian analysis, planning, and cartography. Each section highlights the question, methods, and evidence behind the work.
Municipal GIS + public information
Interactive election information and operational mapping
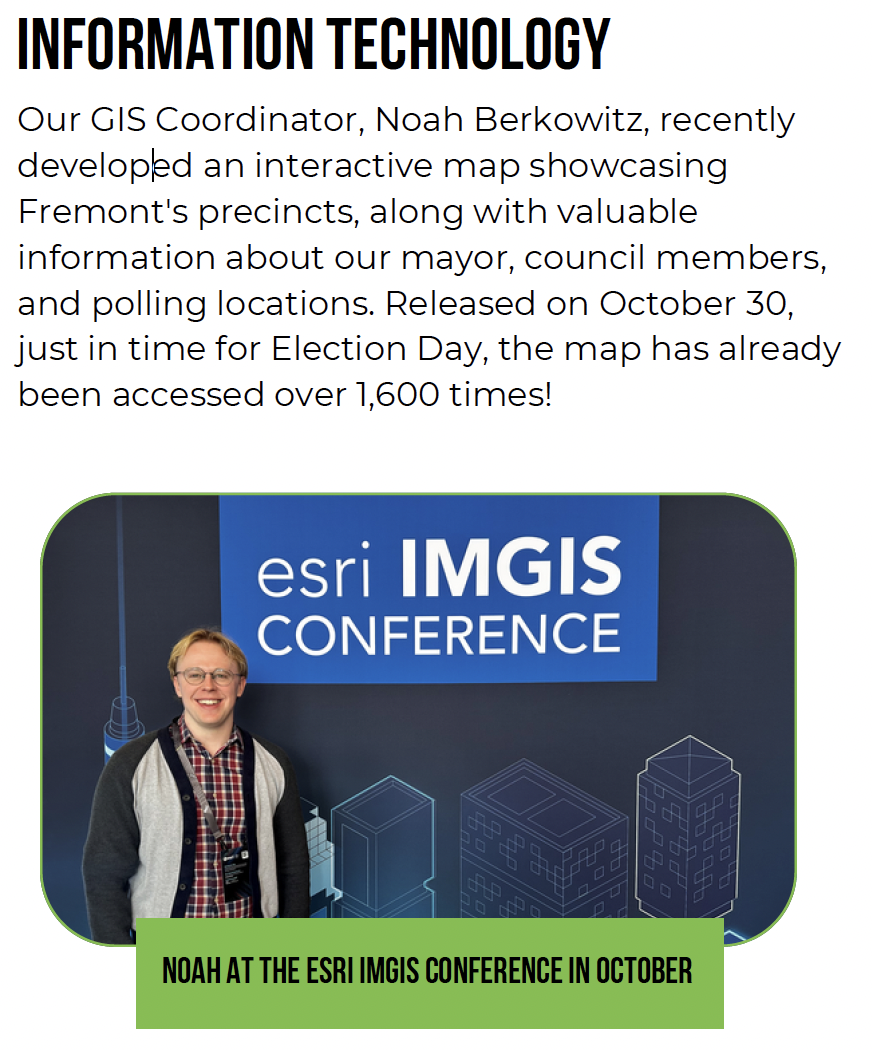
A public-facing City of Fremont map brought precincts, mayor and council information, and polling locations into one interactive experience.
The City’s November 2024 employee newsletter reported more than 1,600 accesses shortly after launch. The project reflects a broader municipal practice spanning enterprise mapping, infrastructure data, utilities, addressing, and clear public information.
Focus: accessible web mapping, election information, municipal spatial data, quality control, and decision support.
Remote sensing + machine learning
Pond aquaculture classification
A pixel-wise classification workflow for identifying pond aquaculture from Sentinel-1 radar and Landsat 8 imagery.
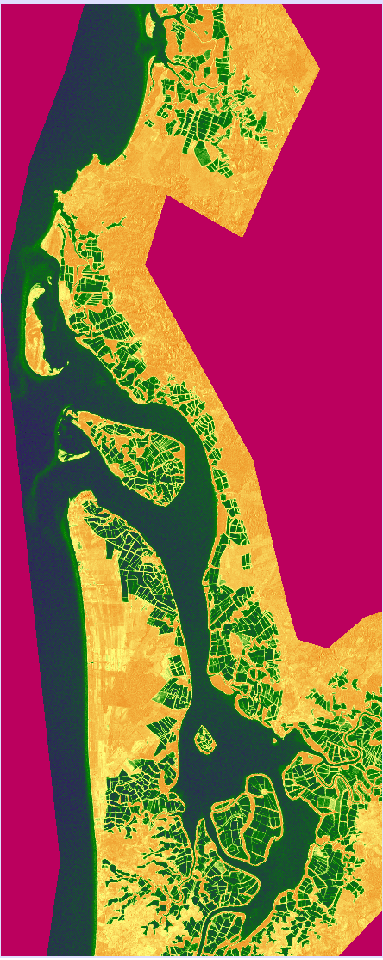
Input: Sentinel-1 radar composite covering the study area.

Method: Support Vector Machine classification in Google Earth Engine.

Output: Grouped classification visualized and refined in TerrSet.
Tools: Google Earth Engine, JavaScript, Sentinel-1, Landsat 8, Support Vector Machine classification, and TerrSet.
Google Earth Engine links may require a Google account and Earth Engine access.
Spatial analysis + public-interest GIS
Analysis designed for decisions
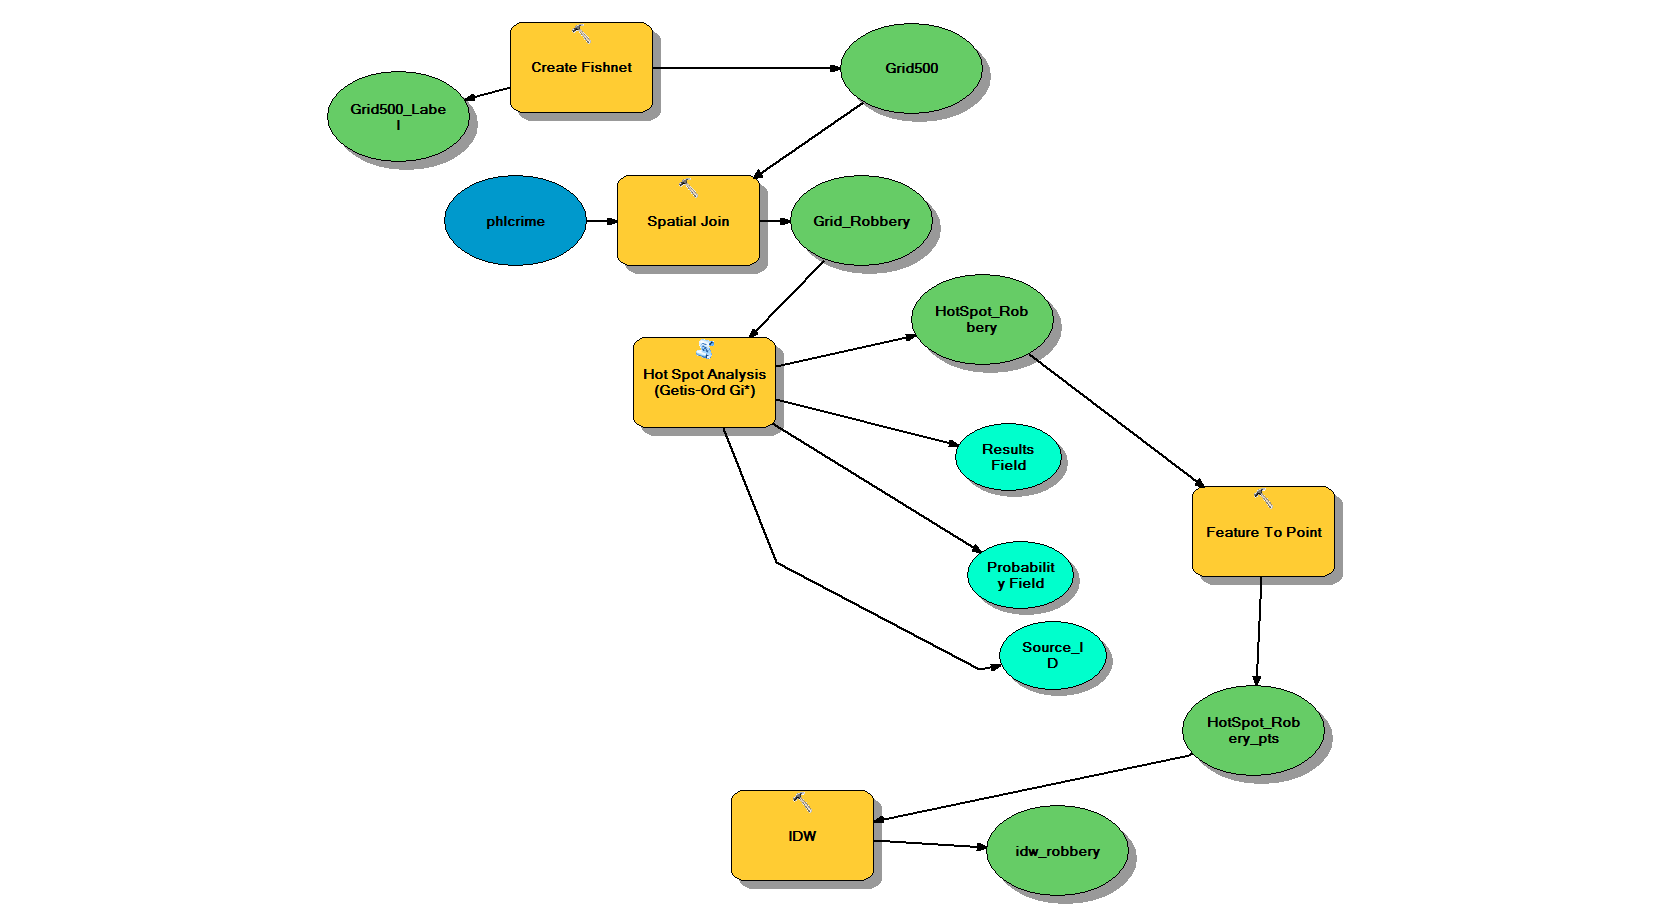
Philadelphia robbery hot spots
Hot-spot analysis of 2014 Philadelphia Police Department robbery data. The map received second place for Best Student Map at RCBC GIS Day 2016.

Historic planning-map mosaic
A georeferenced layer assembled from more than 60 historic mylar map sheets for the Middlesex County Planning Board Division of Spatial Services.
Methods: georeferencing, quality control, mosaic construction, and spatial data management.
Humanitarian GIS
Conflict, access, and settlement analysis
Conflict in the Philippines
An ArcGIS StoryMap using Humanitarian Data Exchange, PhilGIS, ACLED, and Global Terrorism Database sources.
Legacy project note: the original ArcGIS Cascade StoryMap has been retired by its hosting platform. The project description is retained here for the portfolio record.
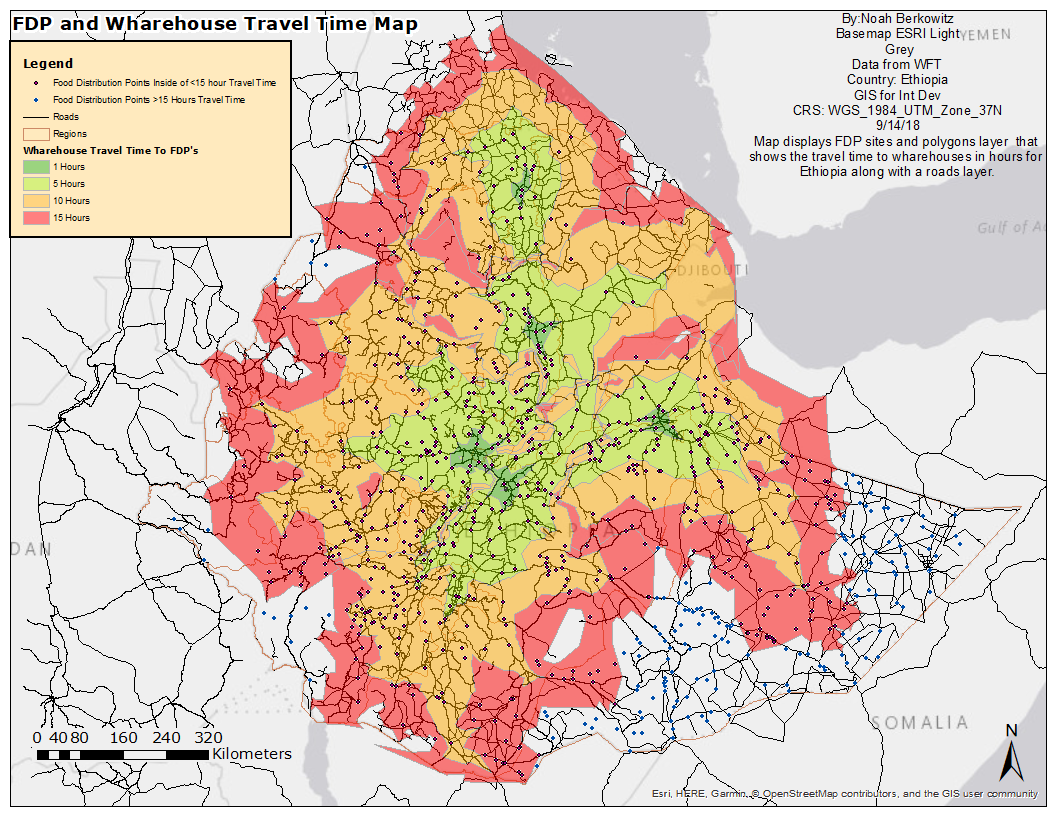
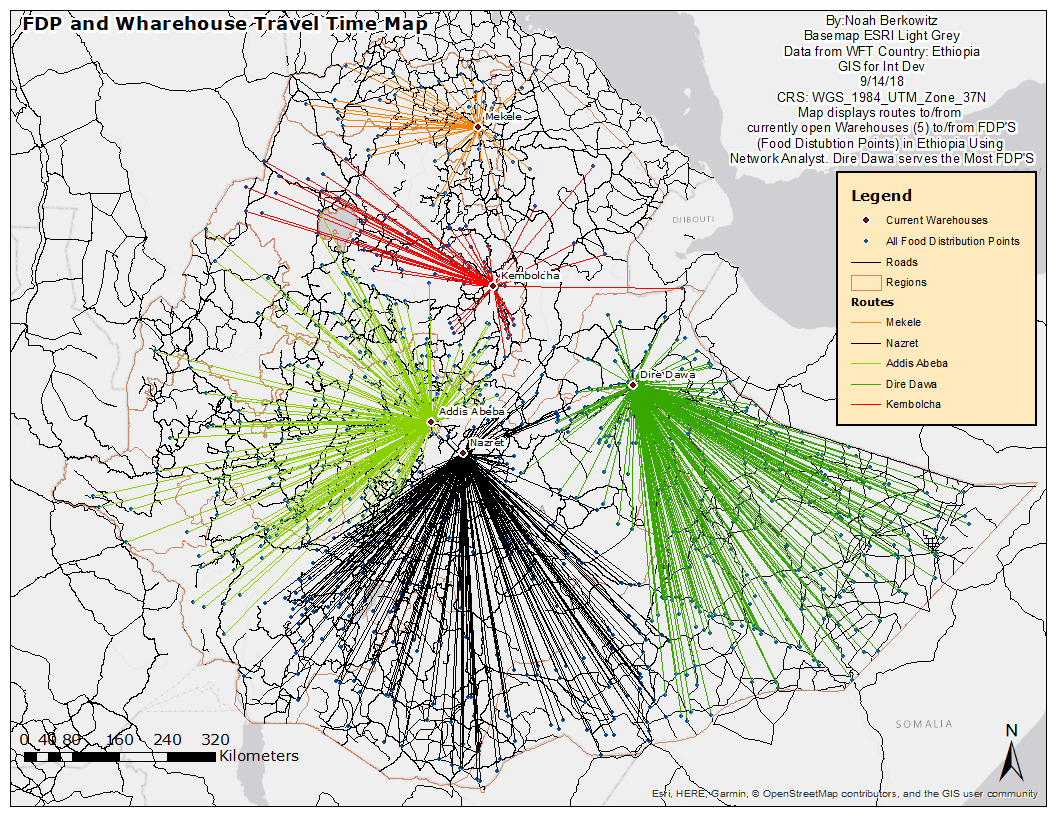
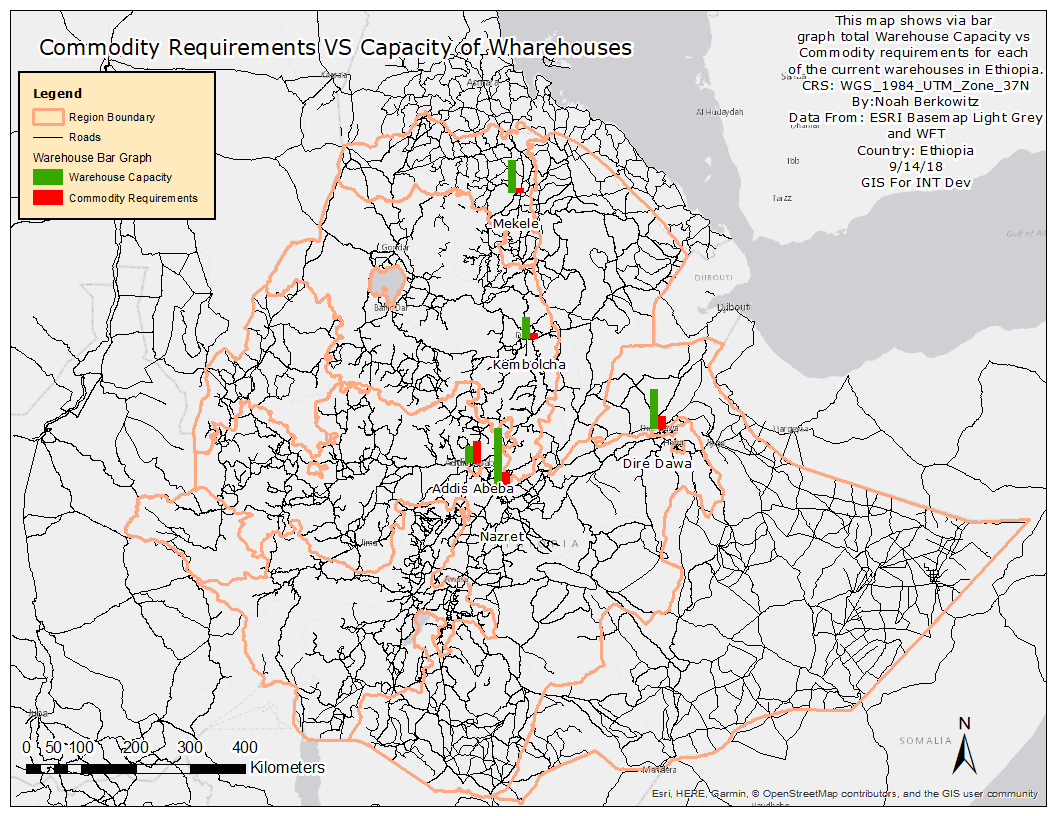
Food-distribution access in Ethiopia
Network and capacity analysis of food-distribution points using QGIS and humanitarian datasets.
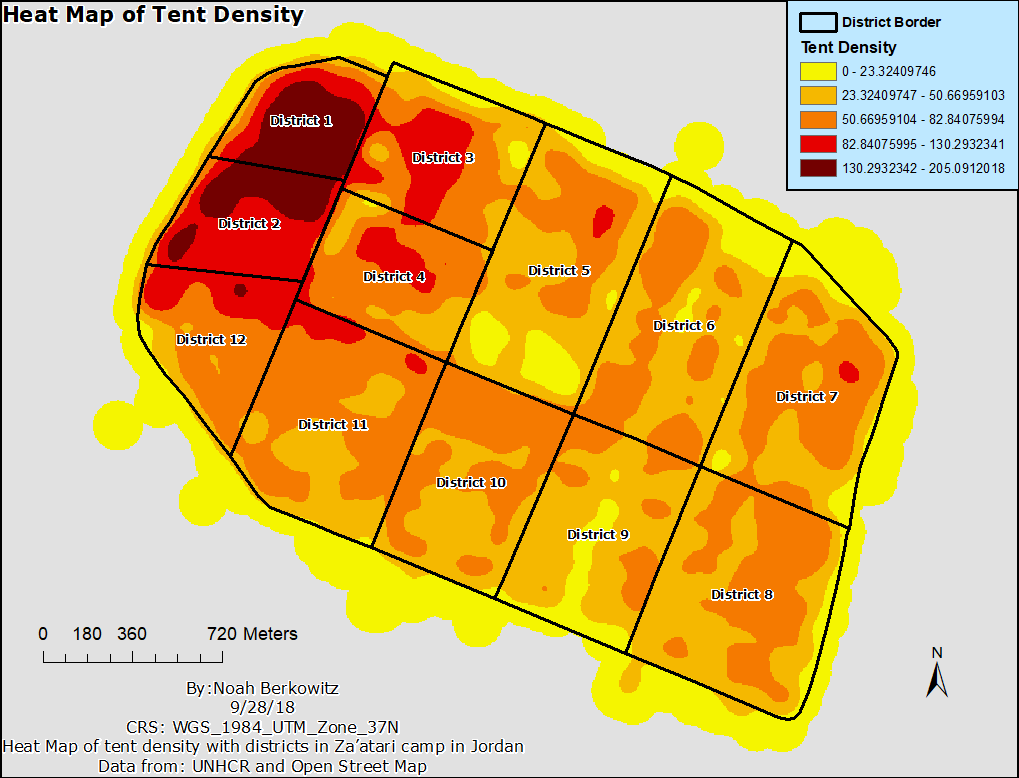
Zaatari refugee-camp density
Kernel-density analysis in QGIS examining the location and clustering of tents using Humanitarian Data Exchange data.
Additional cartography and credentials
- Plant-hardiness color study — cartographic color and ColorBrewer design.
- Healthy Philadelphia street map — street and healthy-corner-store visualization.
- Cartographic-scale series — three maps examining scale and feature selection.
- Kensington, Philadelphia dumps StoryMap — collaborative community geovisualization; the legacy public short link is no longer available.
- 3D Visualization Techniques Using ArcGIS certificate.
- SketchUp Essentials certificate.
Open work
Code & reproducible workflows
Browse public repositories for GIS scripts, geospatial code, and reusable workflows. Project documentation remains paired with the maps, methods, and source material shown throughout this portfolio.
 Noah Berkowitz — GIS & Geospatial Data Science